









Non-Contact Wafer Metrology in Semiconductor Manufacturing: Optical Principles and Tolerances
Non contact wafer metrology combines dual probe spectral confocal sensing, optical through-beam edge alignment, and 3D laser profiling to inspect 200mm and 300mm silicon, SiC, and sapphire wafers without physical surface damage. These optical methods achieve 1µm thickness and flatness accuracy (TTV, bow, and warp), ±0.1° notch and edge alignment repeatability, and high resolution 3D defect mapping for micro scratches and edge chipping at production line speeds.
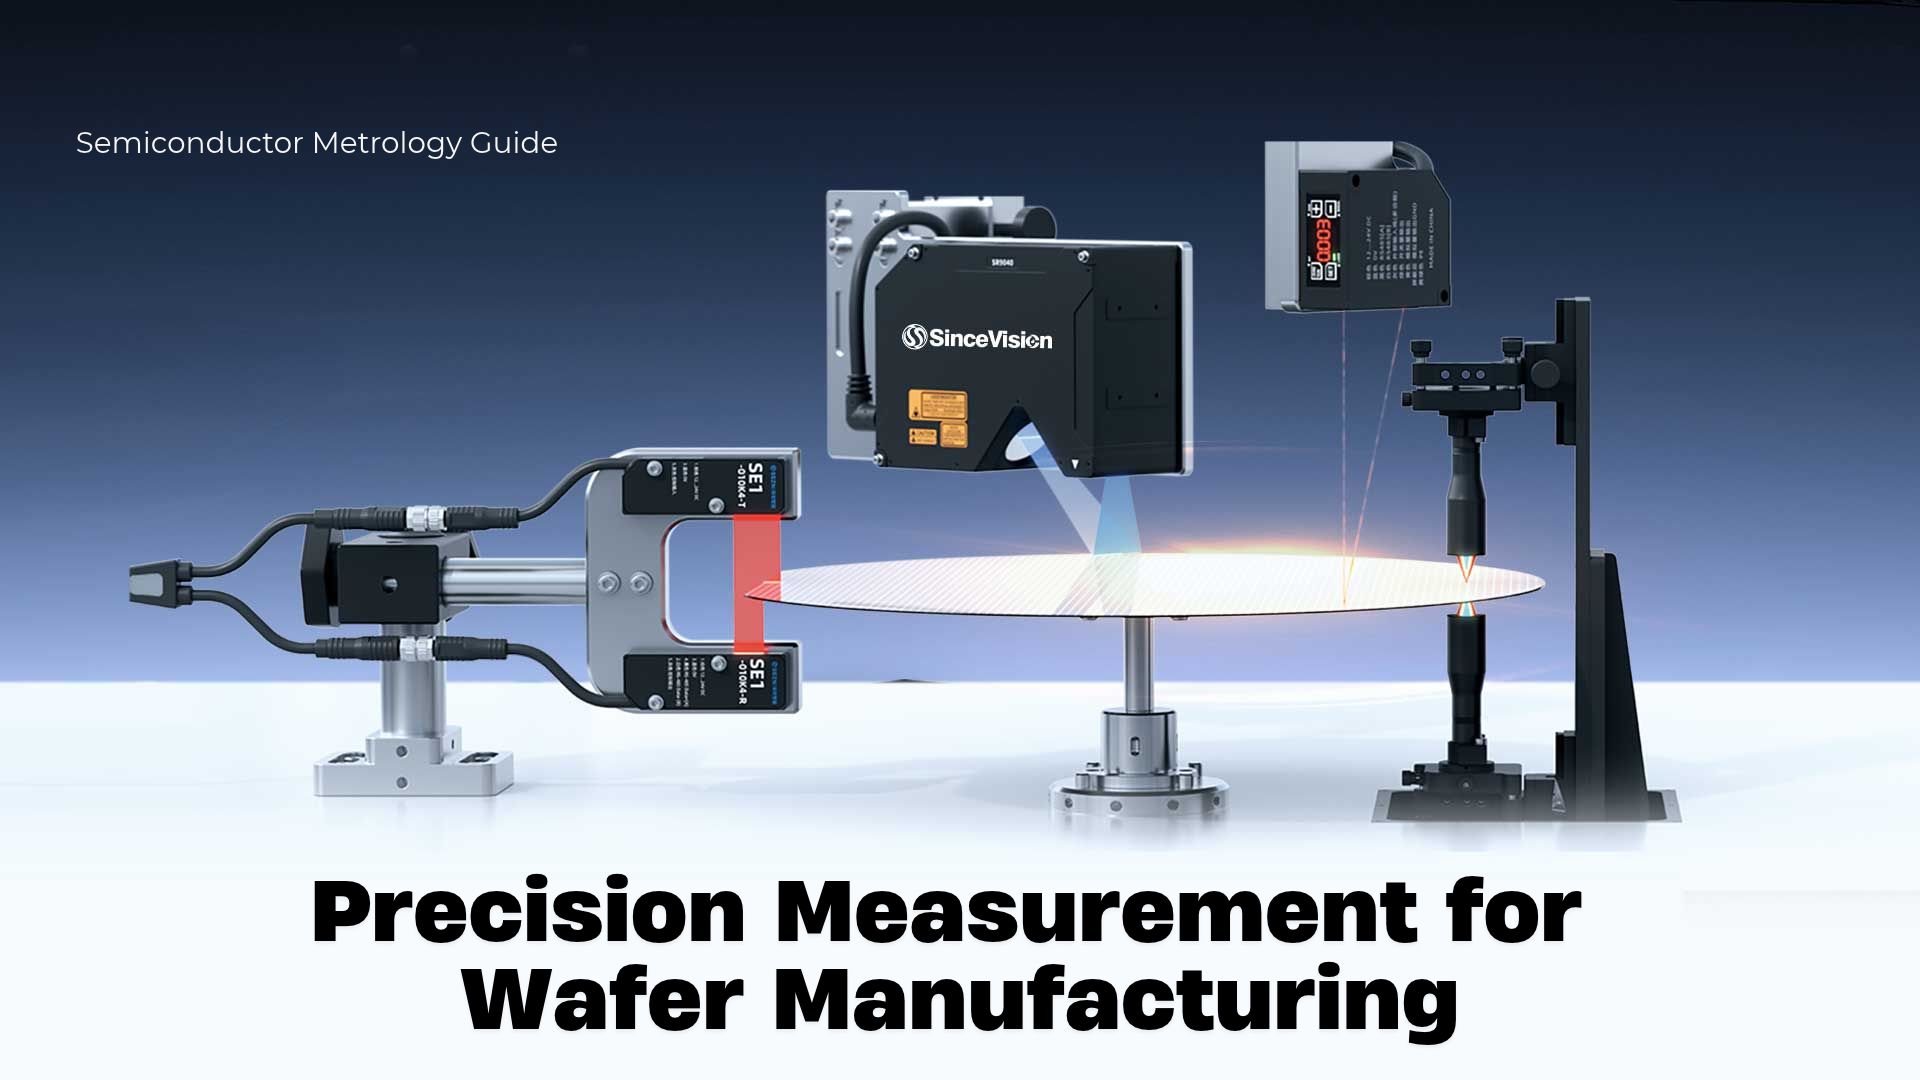


Non contact wafer metrology uses spectral confocal sensing, optical through-beam alignment, and 3D laser profiling to inspect substrates without physical probe contact. In modern wafer manufacturing, these optical methods measure total thickness variation (TTV), bow, and warp to 1µm accuracy, achieve ±0.1° wafer edge alignment repeatability, and detect sub micron surface defects on mirror polished silicon, silicon carbide (SiC), and sapphire wafers at high speed production rates.
Why Does Non-Contact Metrology Matter in Modern Wafer Manufacturing?
As front end semiconductor manufacturing scales toward tighter lithography depth of focus budgets and thinner die architectures, geometric tolerances on 200mm and 300mm silicon wafers have narrowed to the micron and sub micron level. At the same time, power electronics and photonics fabs increasingly process compound and transparent substrates, including SiC and sapphire wafer inspection workflows alongside glass carriers.
Traditional measurement tools struggle under these conditions for three physical reasons:
Mechanical Contact Risk: Tactile styluses and mechanical pins exert localized force on the substrate. On ultra thin ground wafers (often below 100µm) or brittle wide bandgap crystals, physical contact introduces micro scratches, subsurface crystal damage, and edge chipping that propagate into die fractures during thermal cycling.
Specular Reflection and Glare: Mirror polished silicon, epitaxial layers, and bare metal pads act like optical mirrors. Conventional 2D vision cameras and standard laser triangulation sensors suffer from specular saturation when light reflects directly into the detector, or complete signal dropout when angled facets deflect the beam away from the receiving optics.
Transparent Substrate Interference: In SiC and sapphire wafer inspection, light passes through the top surface and reflects off the bottom interface as well as the chuck underneath. Standard single peak triangulation sensors merge these overlapping reflections, corrupting thickness and flatness readings.
Non-contact wafer metrology resolves these bottlenecks by decoupling measurement accuracy from surface hardness, optical opacity, and ambient reflectivity.
How Do You Measure Wafer Flatness and Thickness with 1µm Accuracy?
Wafer flatness and thickness inspection governs downstream process stability during chemical mechanical planarization (CMP), photolithography focusing, and wafer bonding. Process engineers evaluate three core geometric parameters: Total Thickness Variation (TTV), wafer bow, and wafer warp.
Dual Probe Differential Measurement Principle
Measuring absolute thickness on an unmounted or vacuum chucked wafer requires eliminating mechanical stage runout and chuck flatness errors. Engineers achieve this using a dual probe differential architecture, in which two opposing optical sensors are mounted coaxially above and below the wafer plane.
Calibration Baseline: Before inserting a wafer, both probes measure a certified reference gauge block of known thickness Tref to establish the exact gap distance D between the upper and lower sensor zero planes.
Simultaneous Acquisition: During scanning, the upper probe records the distance Ztop to the wafer front surface, while the lower probe records the distance Zbottom to the back surface using primary-secondary hardware synchronization.
Differential Calculation: True local wafer thickness at any (X, Y) coordinate is computed as T = D - (Ztop + Zbottom). Because vertical stage vibration shifts Ztop and Zbottom in equal and opposite directions, mechanical jitter cancels out mathematically.
Chromatic Spectral Confocal Physics
While laser triangulation struggles on mirror polished or transparent wafers, spectral confocal thickness measurement operates coaxially along a single optical axis. A broadband white light source passes through a specialized chromatic lens that disperses wavelengths across a calibrated Z-axis focal range. Only the specific wavelength focused precisely on the wafer surface reflects back through a confocal pinhole into an internal spectrometer.
Because illumination and detection share the same vertical axis, spectral confocal probes eliminate optical shadowing inside deep trenches and handle steep surface slopes without blind spots. On transparent substrates such as sapphire, glass, or un-doped SiC, a single probe captures distinct spectral peaks from both the air-to-wafer top boundary and the wafer-to-air bottom boundary. Dividing the optical path difference by the material refractive index (n) yields direct single sided multi layer thickness, while dual probe configurations handle opaque doped silicon and bonded wafer stacks.
In production fabs, dual probe spectral confocal sensor setups such as the SCI Series apply this coaxial principle to deliver 1µm thickness and flatness accuracy across reflective 200mm and 300mm silicon wafers as well as transparent compound substrates.
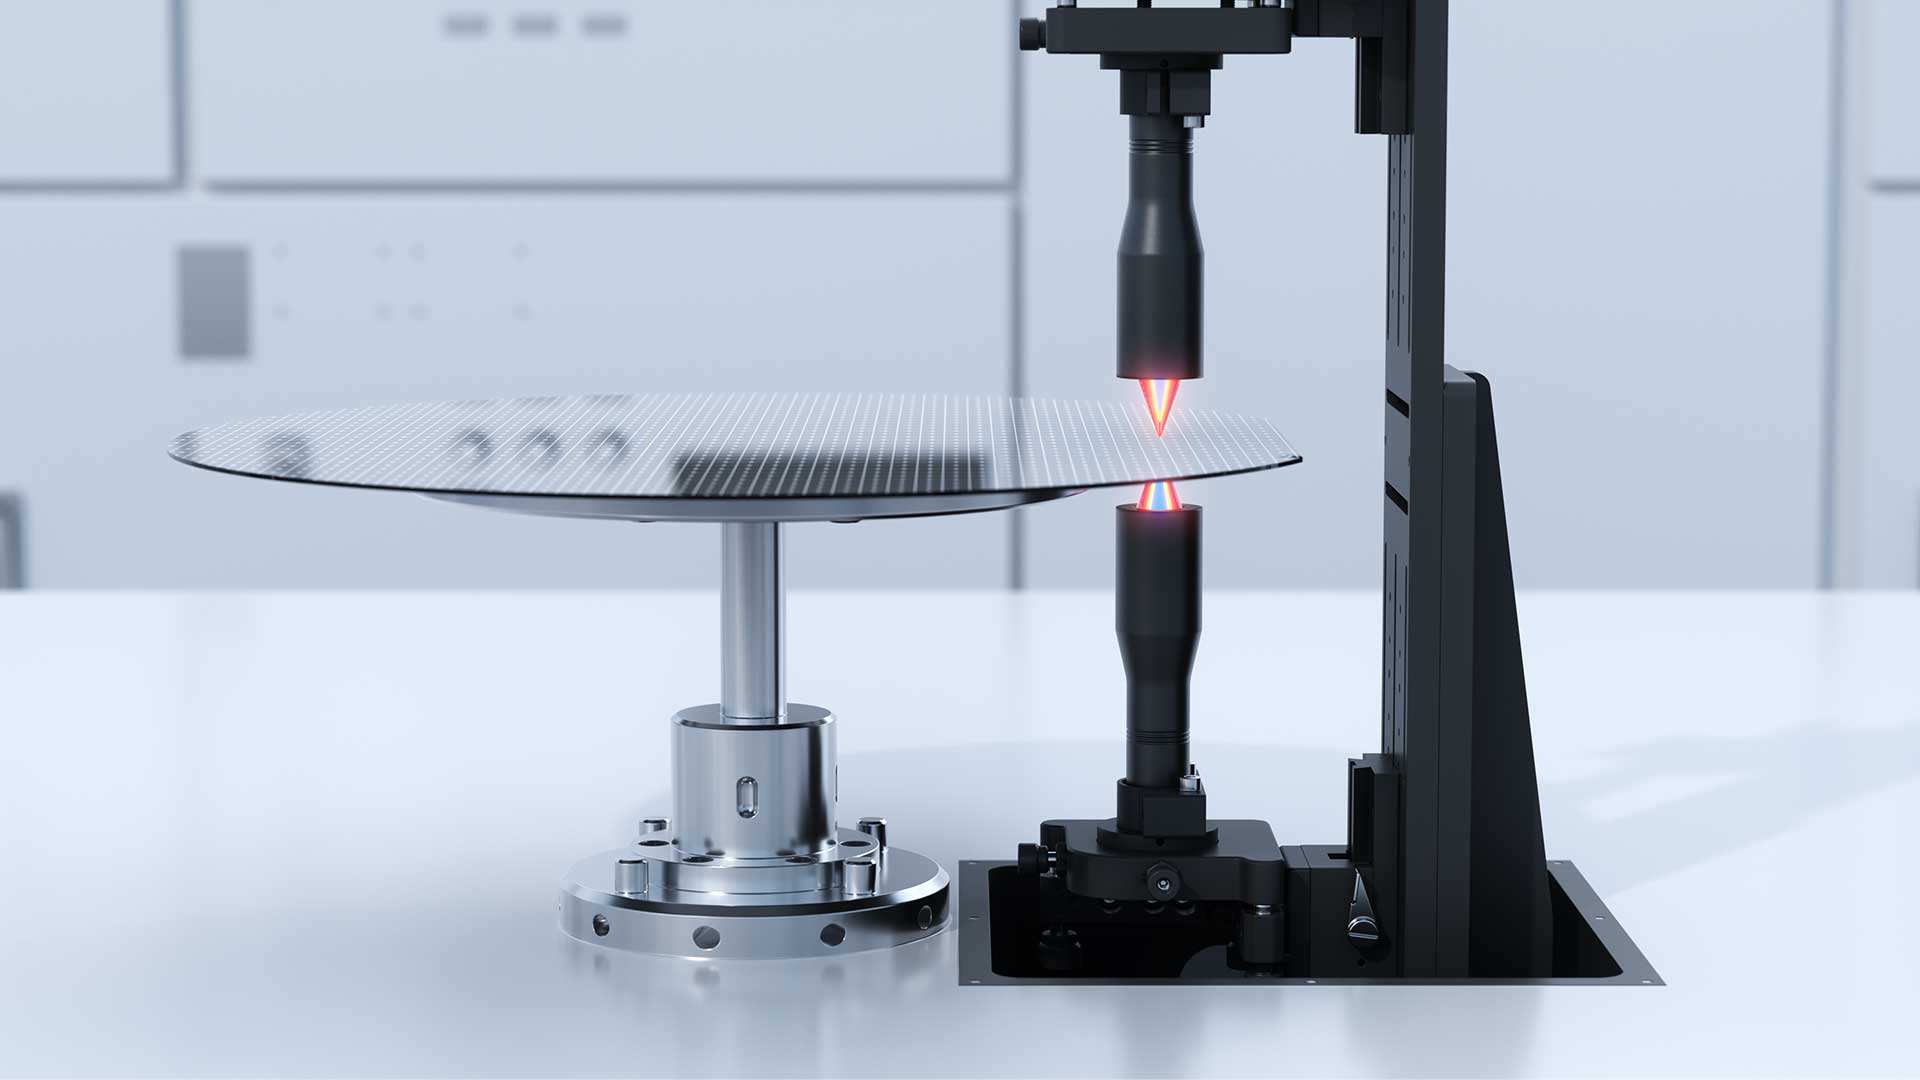 Image 1: Wafer Flatness & Thickness Inspection by SinceVision Spectral Confocal Sensor
How Does Optical Edge Alignment Achieve ±0.1° Repeatability?
Before a wafer enters a lithography scanner, dry etcher, or automated inspection chuck, it must be centered and oriented to a precise crystal axis. Wafer edge alignment locates the wafer center offset relative to the chuck spindle and identifies the angular orientation of the primary flat or V-shaped alignment notch.
High Speed Optical Through-Beam Sensing
Legacy mechanical pre-aligners used physical rollers to push the wafer edge against reference pins. That mechanical contact generated particle contamination and micro chips along the wafer bevel, directly reducing die yield near the perimeter.
Modern non contact wafer edge alignment replaces rollers with high speed optical through-beam sensors positioned at the wafer perimeter. A collimated light emitter projects a uniform curtain of light across the bevel edge onto a high resolution linear detector array:
Centering Calculation: As the wafer rotates through one full revolution on a low contact vacuum spindle, the shadow edge shifts radially on the detector array. Fitting a circle to the radial edge profile determines the exact (X, Y) eccentricity so the robotic end effector can correct center offset before transfer.
Wafer Notch Detection: Standard 200mm and 300mm silicon wafers feature a 1mm deep V-notch (or flat on smaller substrates) indicating crystal orientation. When the notch passes through the light curtain, the sharp radial step change triggers an angular encoder capture in real time.
Sub-Degree Precision: High sampling rates allow the edge profile to be oversampled across thousands of angular increments per revolution, suppressing edge roughness noise and isolating true notch geometry even on translucent sapphire or glass wafers with tailored optical thresholds.
In automated equipment front end modules (EFEM) and wafer sorters, optical through-beam edge sensors like the SE1 Series execute high speed centering and wafer notch detection at ±0.1° repeatability without touching the fragile bevel edge.
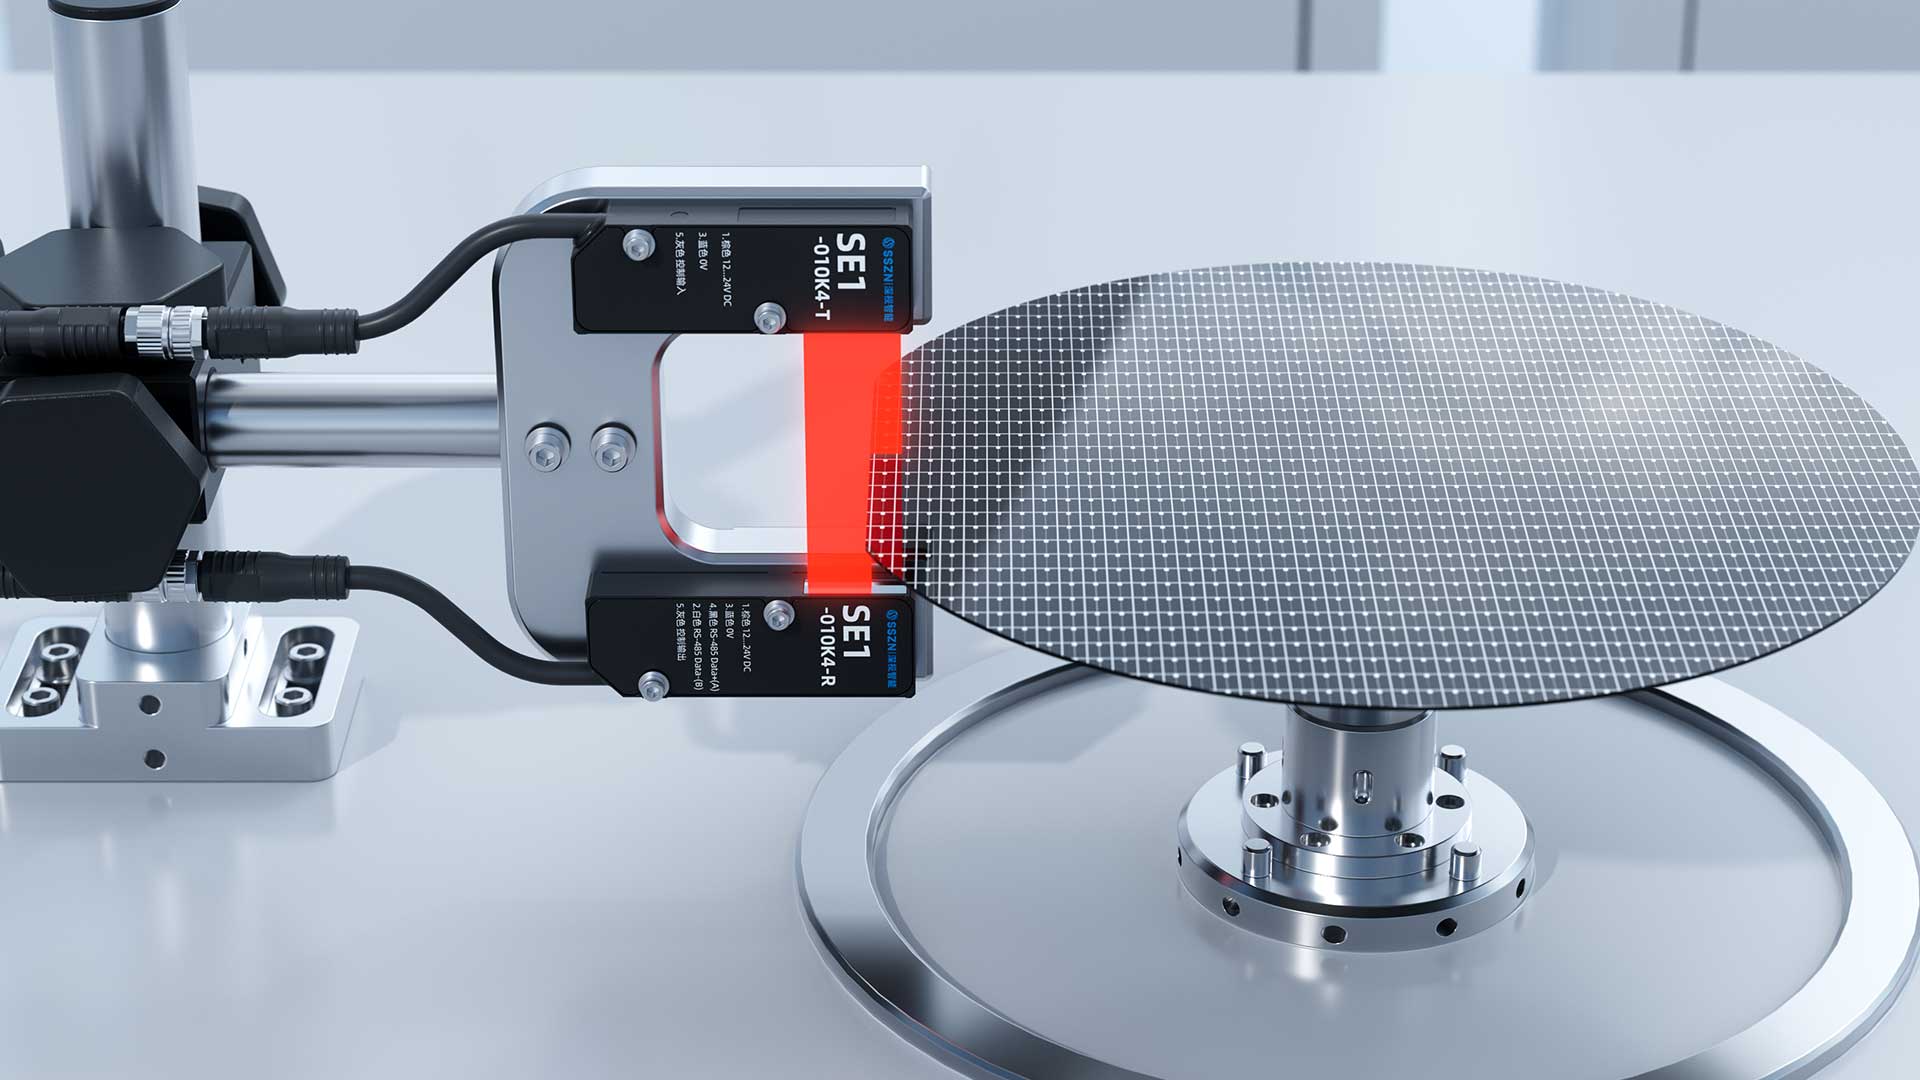
Image 2: Wafer Edge Alignment by SinceVision Through-beam Edge Sensor
How Can 3D Laser Profiling Detect Micro Scratches and Surface Defects?
Wafer surface inspection identifies physical anomalies such as micro scratches, CMP dishing, pits, residual particles, and peripheral edge chipping before costly downstream deposition or patterning steps.
Separating Topography from Reflectivity
Conventional 2D brightfield and darkfield vision systems rely on grayscale intensity differences to flag defects. On patterned wafers, multi layer thin films, or brushed backside silicon, normal color and reflectivity variations create intense visual clutter. A minor oxide thickness shift can mimic a stain, while a shallow scratch on a mirror polished surface may reflect too little contrast to trigger a 2D threshold.
High resolution 3D laser profiling solves this ambiguity by capturing true Z-axis elevation across a wide X-axis laser line in a single linear pass:
Line Triangulation Geometry: A precision laser line is projected across the wafer surface while a high speed CMOS camera observes the line profile at a calibrated triangulation angle.
Height Map Reconstruction: As the wafer translates beneath the sensor, consecutive cross-sectional profiles assemble into a dense 3D height map. Because measurements are recorded in physical height coordinates rather than brightness values, background film color variations disappear.
High Dynamic Range (HDR) Exposure: Specular surface defect inspection requires handling extreme light ratios between mirror flat die areas and rough scribe lines or bevels. Multi slope HDR exposure control prevents pixel saturation on bright metallic bond pads while preserving signal-to-noise ratio inside dark micro scratches and pits.
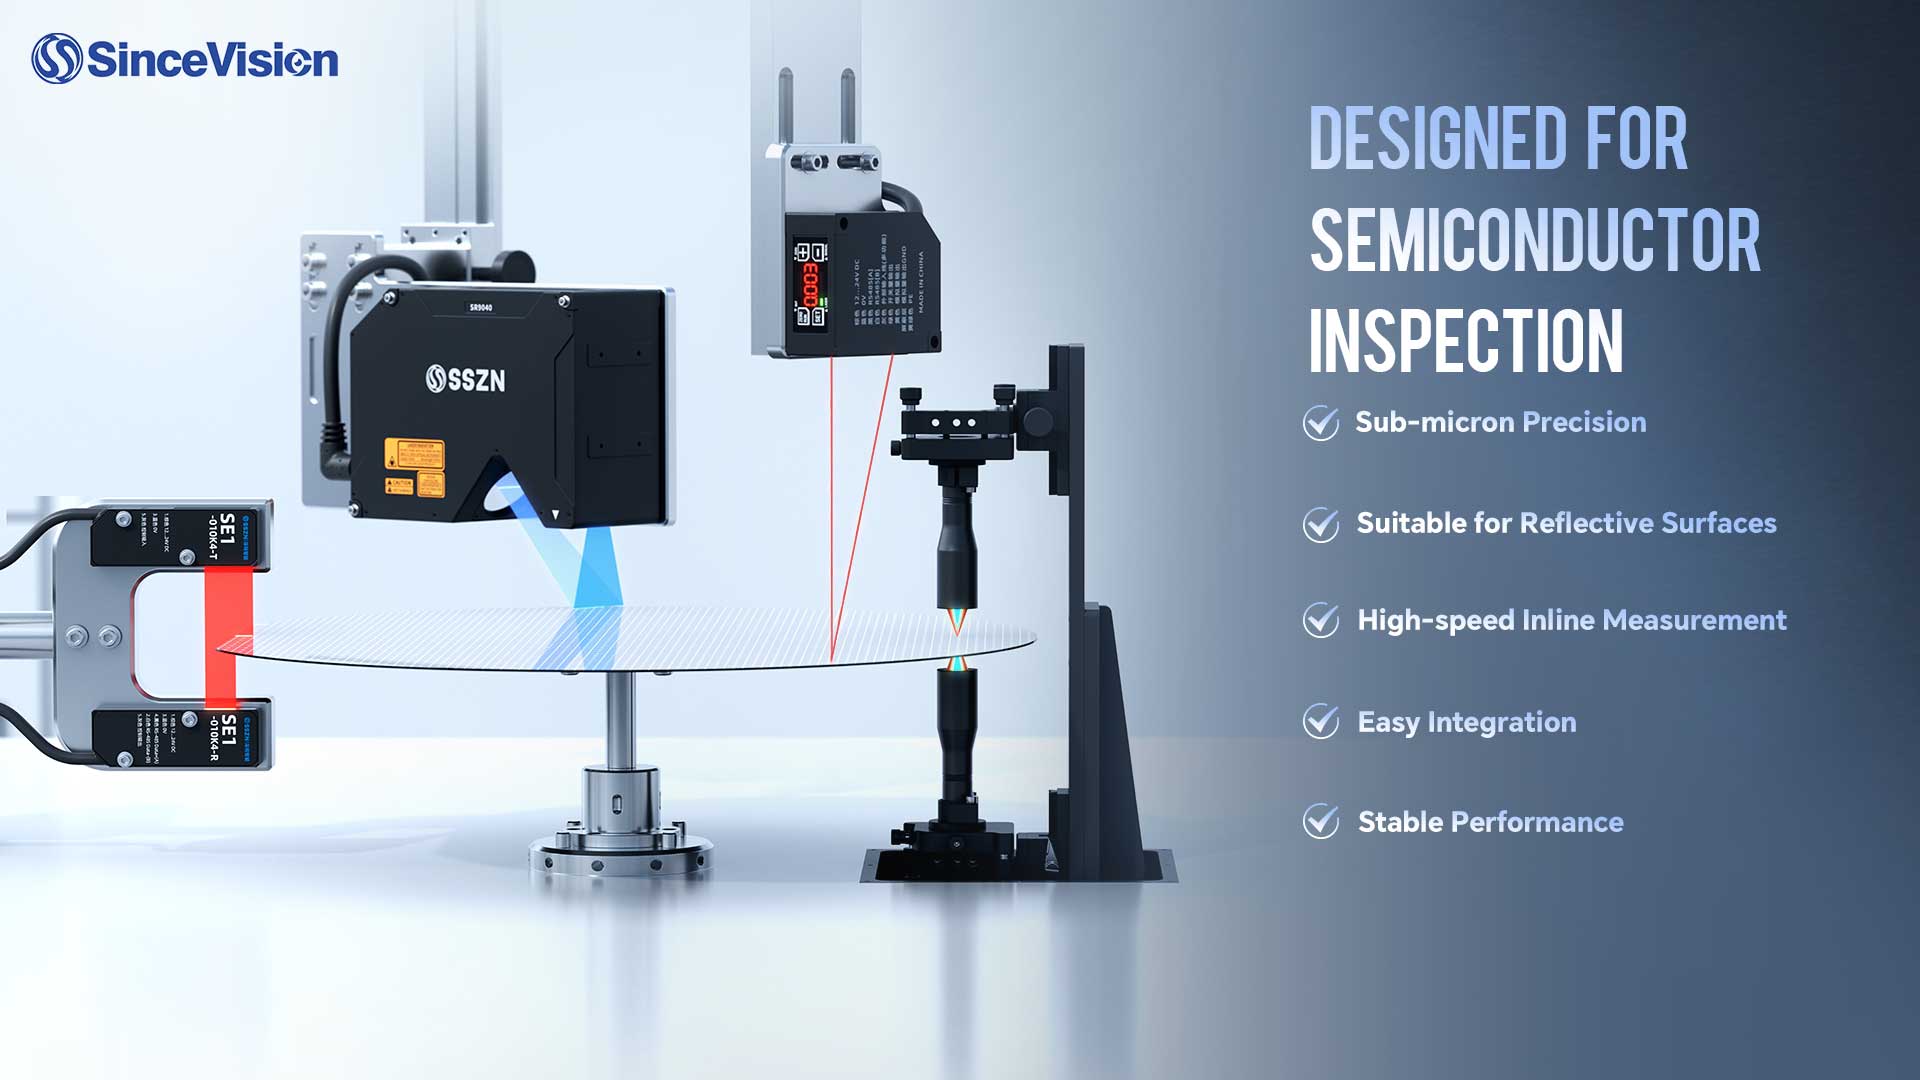
In high throughput fab tools, 3D laser profilers such as the SRI Series generate sub micron height maps at line speed, enabling deterministic pass/fail sorting for surface defects, bump coplanarity, and edge chipping.
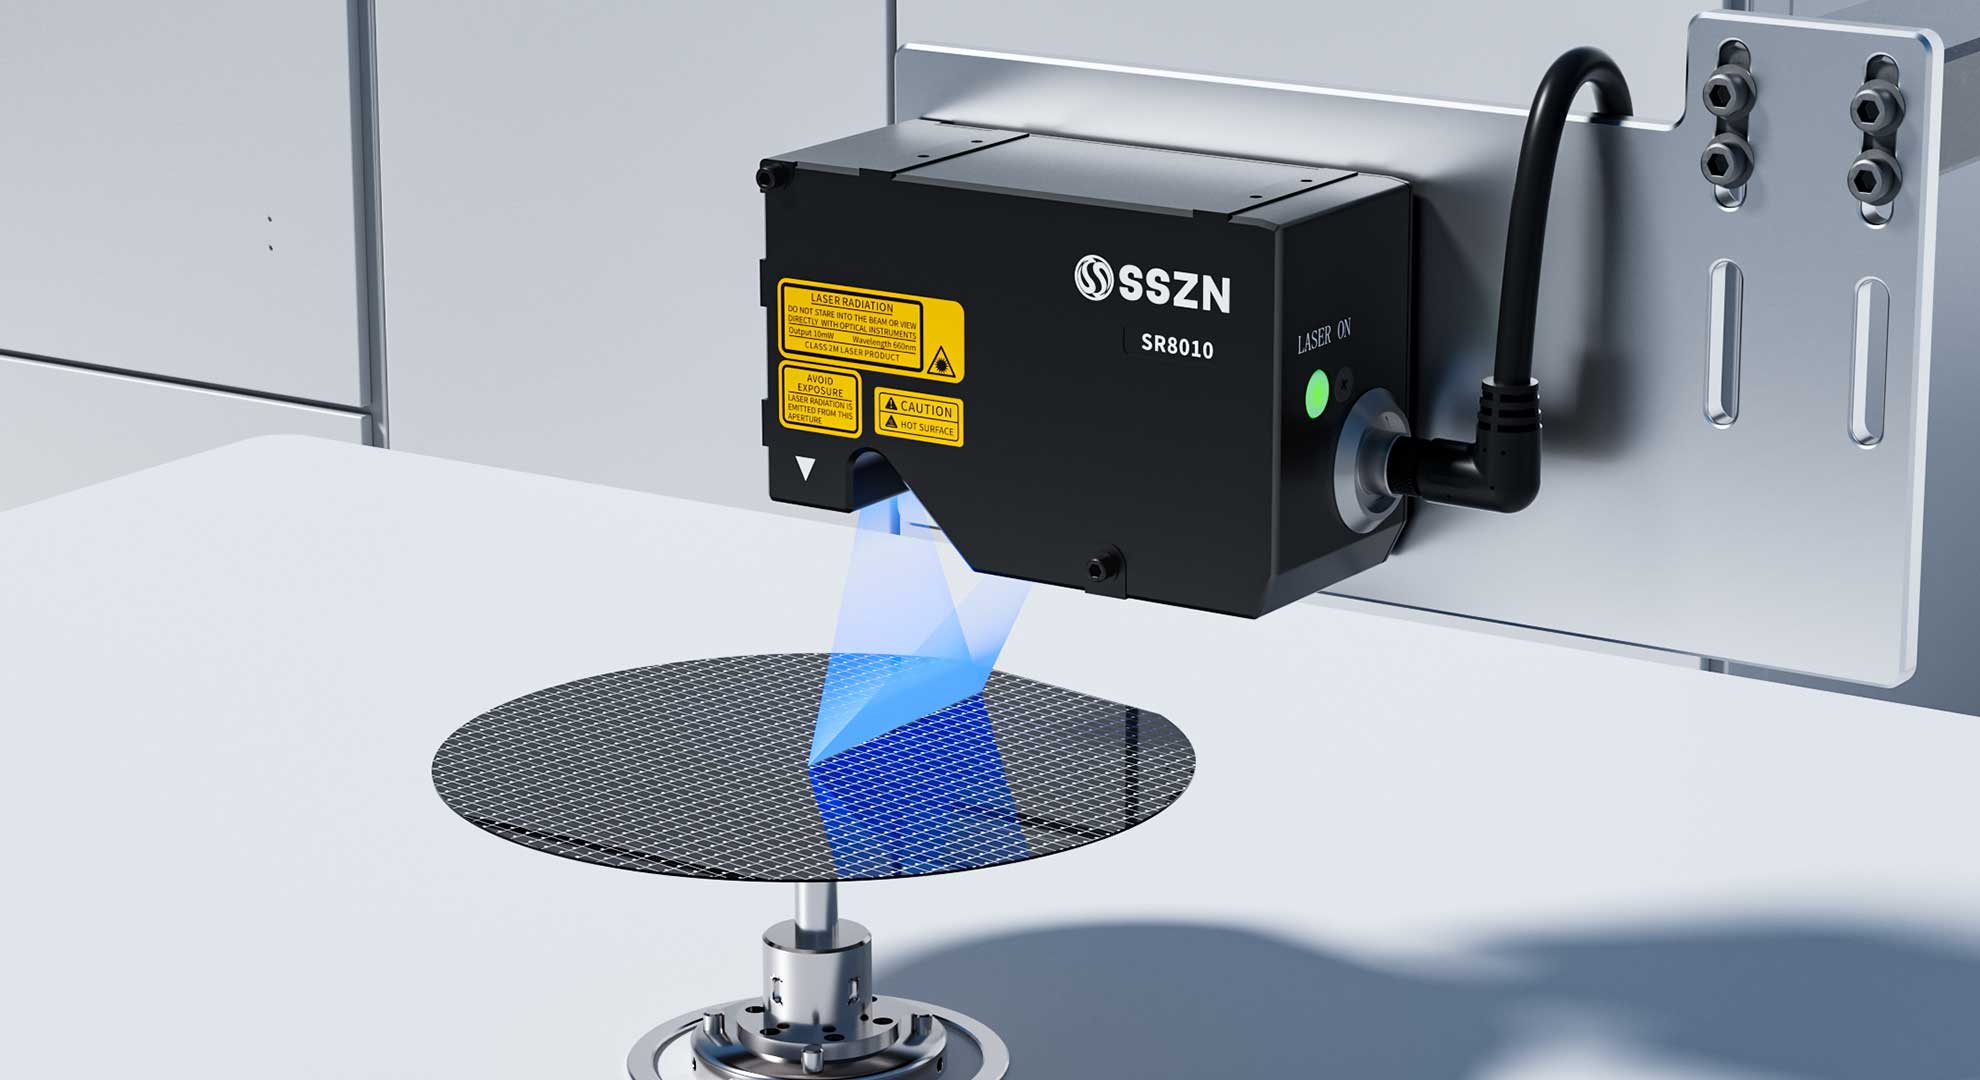
Image 3: Wafer Surface Inspection by SinceVision 3D Laser Profiler
Wafer Manufacturing Metrology Comparison Table
The table below summarizes how these three non contact optical sensing architectures map to primary wafer inspection stages.
| Inspection Application | Optical Sensing Principle | Primary Metrology Challenge | Example Sensor Architecture | Key Performance Benchmark |
Wafer Flatness & Thickness Inspection | Dual probe spectral confocal | Specular reflection & transparent substrates | SCI Series | 1µm accuracy |
Wafer Edge Alignment | Optical through-beam sensing | High speed notch detection without edge chipping | SE1 Series | ±0.1° accuracy |
Wafer Surface Inspection | 3D laser profiling | Detecting micro scratches on reflective surfaces | SRI Series | High resolution 3D defect mapping |
Next Steps for Metrology and Process Engineers
Evaluating optical sensors on actual production substrates is the fastest way to validate signal stability across your specific doping levels, surface finishes, and thin film stacks. To review real-world test data, optical configurations, and tolerance benchmarks across 200mm and 300mm wafers, download the full application cases on the SinceVision Semiconductor Solutions page.
Frequently Asked Questions
What is the difference between TTV, bow, and warp in wafer manufacturing?
Total Thickness Variation (TTV) measures the difference between the maximum and minimum thickness across the entire wafer, independent of bending. Bow measures the vertical deviation of the wafer center point from a three-point reference plane, while warp captures the maximum peak-to-valley shape distortion across the entire unclamped wafer surface, including asymmetric saddle or potato-chip deformations.
Why are spectral confocal sensors preferred over laser triangulation for silicon and SiC wafer thickness?
Spectral confocal sensors operate coaxially along a single optical axis, eliminating triangulation shadowing and specular glare dropouts on mirror polished silicon. On transparent SiC and sapphire wafers, a single confocal probe also separates top and bottom surface reflection peaks simultaneously, allowing direct refractive-index-compensated thickness calculation without backside signal interference.
How does non contact wafer edge alignment prevent wafer damage during handling?
Non contact wafer edge alignment uses collimated through-beam light curtains to track the bevel perimeter and locate the alignment notch optically while the wafer rests on a vacuum spindle. Eliminating mechanical contact rollers prevents perimeter micro chipping, bevel scratches, and particle generation that otherwise degrade edge die yield during lithography and etching.
Can 3D laser profilers inspect both mirror-polished and patterned wafer surfaces?
Yes. By using high dynamic range (HDR) exposure control and narrow-wavelength laser lines, 3D laser profilers suppress specular saturation on mirror polished silicon while capturing weak reflections inside etched trenches and patterned dies. Because defect detection relies on true Z-axis height variations rather than 2D brightness, film color changes do not cause false rejects.
What environmental and integration factors matter most when deploying optical sensors in wafer fab equipment?
Process engineers must prioritize rigid, thermally stable sensor mounting frames to minimize structural drift relative to the wafer stage. Cleanroom compatibility, low heat dissipation inside mini-environments, primary-secondary encoder synchronization for deterministic spatial triggering, and vibration isolation from robotic transfer arms are essential to maintain sub micron repeatability.

Featured Sensor
SRI7400
SRI7700
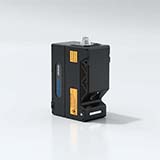
SRI8020
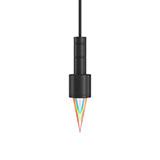
SCI04020

SCI04025
You can also read
Non-Contact Wafer Metrology in Semiconductor Manufacturing: Optical Principles and Tolerances
Nov 18, 2026
High-Speed Imaging: Engineering Principles, Optical Trade-Offs, and R&D Applications
Nov 12, 2026
Laser Triangulation Solves New 3D Inspection Demands in AI Computing Era
Nov 10, 2026
How 3D Line Laser Profilers Solve Critical Challenges in Automotive Tire Manufacturing
Nov 09, 2026
3D Laser Profiler Inspection for AI Server High-Speed Connectors and Chassis Assemblies
Oct 29, 2026



 Compare
 Clear the comparison bar

