










High-Speed DIC Impact Testing: Bicycle Wheelset Deformation Analysis Using SinceVision SH6-113
The SinceVision SH6-113 ultra-high-speed camera records composite bicycle wheelset drop-weight impact tests at 10,000 FPS, enabling synchronized full-field Digital Image Correlation (DIC) and rigid-body kinematic tracking without motion blur. By resolving transient localized strain hotspots up to 2.6 × 10³ με (2,600 με) alongside an 80g impact deceleration spike, the system provides high-fidelity empirical data to validate dynamic composite FEA simulation models.
 Product Inquiry
1. Quick Summary & Engineering Fact Sheet
In drop-weight impact testing of composite bicycle wheelsets, ultra-high-speed imaging paired with Digital Image Correlation (DIC) delivers synchronized measurement of full-field structural strain and rigid-body impactor kinematics. Recording at 10,000 FPS (100-microsecond inter-frame interval), the SinceVision SH6-113 ultra-high-speed camera captures transient material responses without motion blur, isolating localized principal strain (E1) hotspots up to 2.6 × 10³ με (2,600 με) while tracking an instantaneous 80g deceleration spike (8 × 10⁵ mm/s²).
| Experimental Parameter | System Specification | Engineering Significance |
High-Speed Camera System | SinceVision SH6-113 Ultra-High-Speed Camera | High spatial resolution coupled with 10,000 FPS throughput |
Optical Configuration | 100 μs exposure time; flicker-free high-CRI DC LED lighting | Eliminates 50/60 Hz illumination banding and dynamic motion blur |
Speckle Pattern Geometry | Stochastic pattern (average 3 to 5 pixels per speckle) | Optimizes sub-pixel correlation algorithms for DIC strain calculation |
Peak Structural Strain (E1) | 2.6 × 10³ με at Point P1 (t = 13.0 ms) | Identifies localized stress concentrations and inter-laminar shear risks |
Impactor Kinematics | Velocity reversal: -2.5 m/s to +2.5 m/s; Peak deceleration: 80g | Decouples true vertical travel from 3.05 mm lateral drift (Dx) |
CAE / FEA Application | Direct material model calibration (LS-DYNA MAT_054/058, Abaqus) | Validates composite failure criteria and dynamic energy absorption |
2. Experimental Background & Optical Setup Best Practices
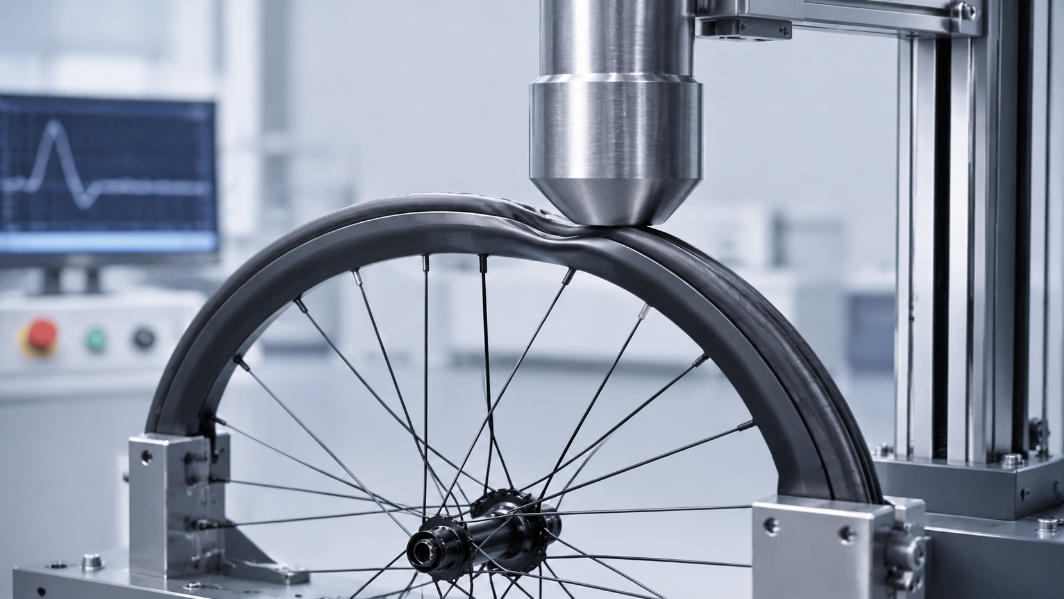
Drop-weight impact testing evaluates the structural safety, impact toughness, and fracture mechanics of carbon fiber composite wheelsets and automotive lightweight assemblies. When an impactor strikes a pressurized tire-wheel system, structural energy dissipation occurs within a transient 20 to 50 millisecond window.
Image 1: Bicycle Wheelset Strain Analysis Setup
The Physical Testing Dilemma
Millisecond-Scale Energy Dissipation: Deformation of the composite rim and elastomeric compression of the tire occur simultaneously upon impact. Conventional industrial cameras running at 500 to 1,000 FPS capture fewer than 10 frames during the critical contact window, failing to register peak strain gradients and rapid crack propagation.
Parasitic Tilt and Lateral Slippage: Single-point tracking assumes an idealized vertical drop. In practice, local tire carcass compliance induces slight rotational tilt and lateral drift (Dx), altering the impact trajectory.
Optical Illumination Controls at 10,000 FPS: With a shutter speed of 100 microseconds, standard AC-powered workshop lighting causes severe 50 Hz/60 Hz intensity flicker and strobing bands. The SinceVision SH6-113 camera experimental setup employs specialized high-power DC LED illumination arrays and low-distortion fixed-focal lenses. Matte white spray coating with randomized black speckles (3 to 5 pixels per dot) ensures reliable sub-pixel grayscale tracking without specular reflection highlights.
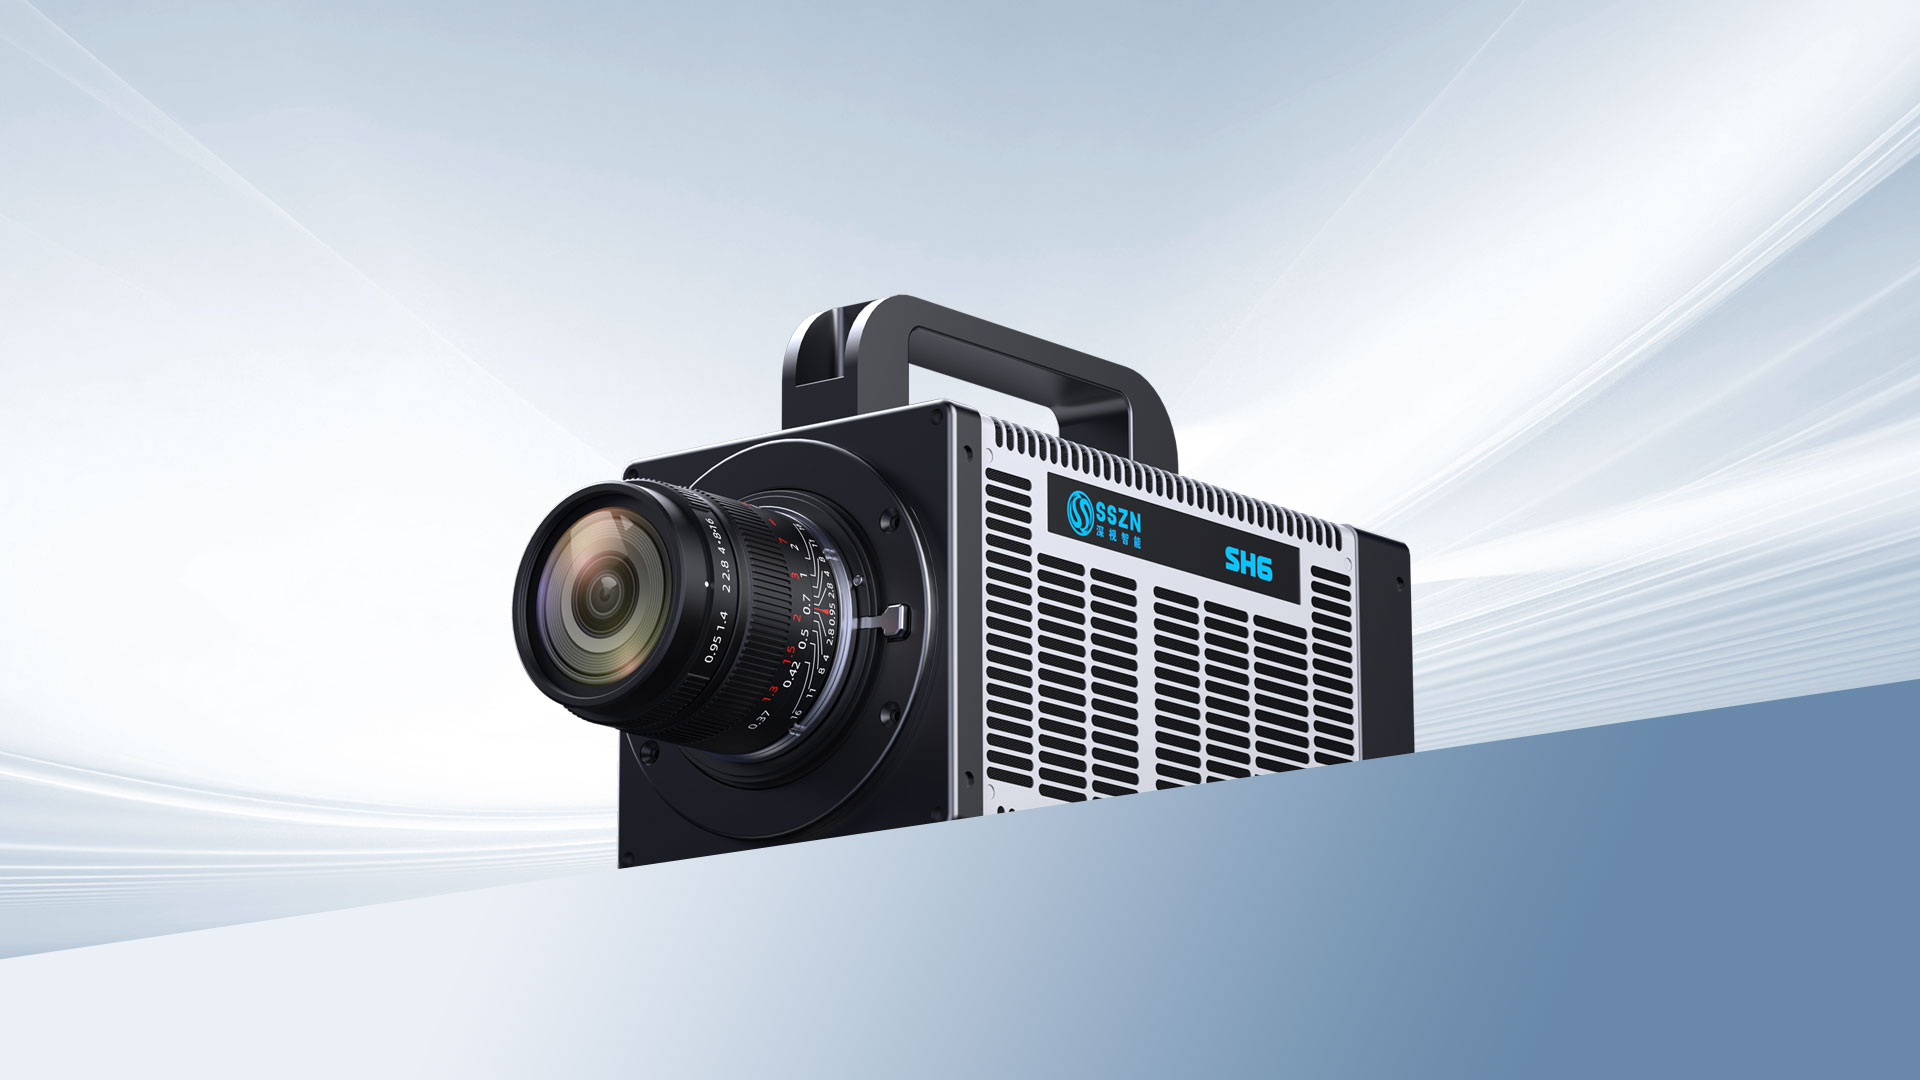
Image 2: SinceVision SH6-113 High-Speed Camera
3. Quantitative DIC Strain Analysis on the Wheel Hub
Digital Image Correlation (DIC) reconstructs full-field displacements by tracking the deformation of surface speckles between consecutive frames. Spatial differentiation of these displacement fields yields true Lagrangian strain maps (E1).
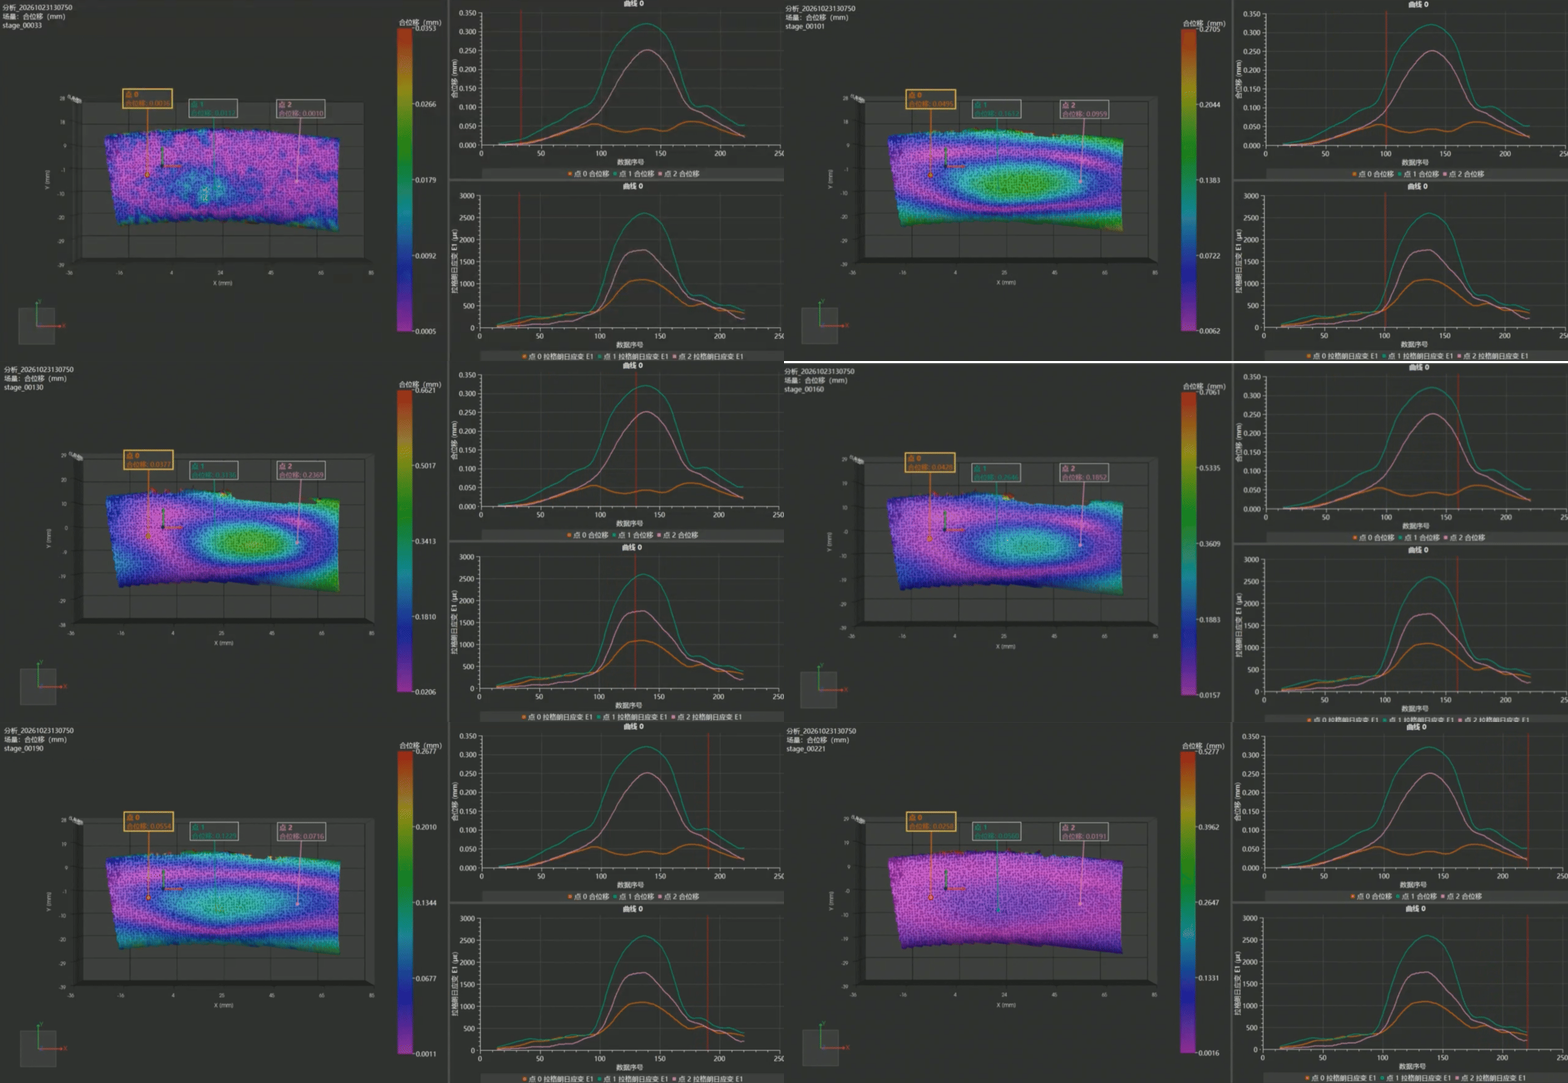
The SinceVision SH6-113 recorded 221 consecutive stages from impact contact through elastic rebound. Three representative evaluation points across the wheel hub illustrate dynamic load propagation:
| Evaluation Point | Peak Resultant Displacement | Peak Lagrangian Strain (E1) | Structural Response Mode |
Point P1 (Upper Rim Hub) | 0.33 mm | 2.6 × 10³ με | Maximum stress concentration zone; primary load transfer path |
Point P2 (Mid Flange) | 0.25 mm | 1.7 × 10³ με | Synchronized timing with P1 but reduced strain magnitude |
Point P0 (Lower Base) | 0.06 mm | 1.1 × 10³ με | Complex, low-amplitude structural damping vibrations |
Temporal Strain Evolution
Initial Onset (t = 10.1 ms): Point P1 displacement registers at 0.1612 mm, with strain beginning to concentrate along the upper rim curvature.
Peak Deformation (t = 13.0 ms): Displacement reaches its maximum of 0.3136 mm at Point P1, corresponding to a peak E1 strain of 2.6 × 10³ με. Point P2 climbs from 0.0959 mm to 0.2369 mm.
Decay and Rebound (t = 16.0 ms to 19.0 ms): P1 displacement decreases to 0.2646 mm and drops to 0.1229 mm as stored elastic energy pushes back against the impactor.
The marked disparity between P1 (2.6 × 10³ με) and P0 (1.1 × 10³ με) demonstrates that impact energy does not disperse uniformly across composite rims. Stress concentrates rapidly along specific curvature transitions, providing clear guidance for localized composite laminate reinforcement.
4. Multi-Point Impactor Kinematics and Tilt Decoupling
Relying on a single point to track an impactor fails to reveal whether the mass experienced angular deflection or lateral slippage during impact. The SinceVision experimental setup placed six discrete optical tracking markers across the impactor head, extracting 3D spatial vectors simultaneously.
Kinematic Phase Analysis
Descent Window (t = 38.1 ms): Six-point displacement remained tightly grouped between 98.2 mm and 101.7 mm, verifying stable vertical travel.
Maximum Impact Travel (t = 52.7 ms): Total stroke peaked between 130.7 mm and 134.4 mm. Across the entire 134 mm stroke, the variance among all six points stayed below 3.7 mm, confirming that the impactor maintained rigid planar alignment without severe pitch or yaw.
Elastic Rebound Phase (t = 84.5 ms): Impactor displacement reversed to 59.2 mm to 60.8 mm.
Calibrated Kinematic Output Curves
Velocity Profile (Vy): The impactor approached the tire at a steady -2.5 m/s. Following contact, velocity reversed to +2.5 m/s, reflecting an elastic rebound of the tire-wheel system under the tested load.
Lateral Coupling (Dx): The maximum lateral drift reached 3.05 mm, highlighting slight out-of-plane forces induced by asymmetric tire carcass flexing.
Impact Deceleration (Ay): Differentiating the velocity curve revealed a sharp acceleration spike at contact (t = 52.7 ms), peaking at 8 × 10⁵ mm/s² (~80g).
5. CAE and Finite Element Model (FEA) Calibration
High-speed DIC databridges the gap between theoretical finite element analysis (FEA) and physical component testing:
Constitutive Model Tuning: Transient full-field strain maps provide direct calibration parameters for composite progressive damage models (such as MAT_054/MAT_058 in LS-DYNA or Hashin damage criteria in Abaqus).
Boundary Condition Validation: The measured 3.05 mm lateral displacement (Dx) and 80g deceleration curve serve as empirical boundary inputs, replacing idealized zero-friction simulation constraints with real-world physical behavior.
Laminate Optimization: Identifying that Point P1 absorbs over twice the strain of Point P0 allows structural engineers to adjust carbon ply orientations and core thicknesses selectively, reducing weight while maintaining structural safety margins.
6. Frequently Asked Questions (FAQ)
Why is 10,000 FPS necessary for drop-weight impact testing?
During dynamic drop impact, peak contact deceleration and material deformation occur within 2 to 5 milliseconds. Standard cameras recording at 1,000 FPS capture only 2 to 5 frames during this phase, missing peak strain and micro-cracking events. The SinceVision SH6-113 records at 10,000 FPS (a 100 μs inter-frame interval), providing dozens of high-resolution images to accurately map strain evolution and peak deceleration.
How does Digital Image Correlation (DIC) measure strain on composite structures?
DIC tracks the spatial displacement of high-contrast surface speckle patterns between successive frames. Mathematical algorithms compare the deformed state against an undeformed reference image, calculating sub-pixel coordinate shifts. Differentiating these displacement fields generates full-field principal strain (E1), shear strain, and von Mises strain maps without physical strain gauges.
What is the advantage of six-point impactor tracking over single-point tracking?
Single-point tracking measures only gross vertical displacement (Dy). Six-point tracking calculates multi-point spatial vectors, allowing engineers to verify whether the impactor tilted, rotated, or experienced lateral deflection (Dx) during contact with the test specimen.
What optical setup was used in this bicycle wheelset impact test?
The test utilized the SinceVision SH6-113 ultra-high-speed camera recording at 10,000 FPS, integrated with high-intensity flicker-free DC LED illumination, high-resolution low-distortion optics, and dedicated motion analysis and DIC post-processing software.







 Compare
 Clear the comparison bar

